Administration Tools
Namespaces in code samples:
kern.on a class andkern__on an object, field, or metadata type mark the managed package's namespace. On the managed package, framework references need those prefixes even where a sample omits them; repackaged under your own namespace, replacekern/kern__with your prefix; on an unmanaged deploy, drop them. See How to read the code samples.
What problem does this solve?
Running a Salesforce integration in production comes down to three jobs you do again and again: watching what your integrations and jobs are doing, working out what went wrong when one fails, and setting up new automation as the team grows. Out of the box, each of those means assembling your own kit: Postman for callouts, throwaway anonymous Apex, a streaming client to watch events, a hand-written audit to find sensitive fields, and a scatter of list views and debug logs to reconstruct what happened. Most teams build and maintain that kit themselves.
KernDX gives you one place to do all of it: the Kern app. It opens on a home page that first checks whether your org is set up correctly, then gives you the record tabs and tools to monitor your integrations, troubleshoot a failure, and build new automation, without leaving the org.
It is for the admins, developers, and reviewers who run a KernDX org day to day. Turn to it whenever you need to see, exercise, or fix something that is normally invisible or awkward to set up by hand.
Mental model
Think of the Kern app as the control room for your KernDX org. The work itself (your integrations, events, and async jobs) runs the same whether or not anyone is watching. The control room is where you go to see what is happening and act on it.
It is laid out around the three jobs you came to do:
- Monitor the integrations, events, and jobs you run.
- Troubleshoot a failure, down to the step that broke.
- Develop and onboard: schedule work, wire up a new org, and roll features out.
You enter through the home page. It shows a readiness banner (a quick check that the org is configured correctly) above a set of launch cards for the interactive tools, and the app's tabs give you the underlying records: your API calls, logs, scheduled jobs, and async runs.
Use this when
- You want to monitor your own integrations and jobs. Watch API calls, platform events, Change Data Capture, and async chains as they happen, check what is consuming your org limits, and review the logs and call history, without standing up your own streaming client or stitching together list views.
- You need to troubleshoot a failure. Fire a real Apex callout or inbound endpoint without Postman or throwaway anonymous Apex, see which step of a multi-step async job broke and how far it got, browse what your code logged grouped into recurring problems, and find and retry the integration calls that failed.
- You are developing or onboarding an org. Schedule a recurring job without writing scheduling code, build a deployable masking configuration from a scan instead of auditing for sensitive fields by hand, generate the small class that points the framework at your own Apex, and turn features on or off as you roll them out.
When the native Salesforce tool is enough
Reach for the built-in option when it already covers your need; it is less to learn and nothing extra to maintain.
- For a quick one-off, the Developer Console, anonymous Apex, or a REST client like Postman is enough to fire a single callout, and Salesforce's own Streaming Monitor and debug logs handle a simple event or a single trace.
- For org-wide posture, Salesforce has its own tools: Setup's Health Check scores your org's security settings, System Overview and the platform limits show usage, and Login History reports who signed in. The KernDX versions are narrower on purpose: they watch your KernDX configuration and integrations, not your whole org.
- For simple scheduling, the Setup "Schedule Apex" screen can start a job if you are comfortable with cron and already have a schedulable class.
Each tool below says where the native option overlaps it, so you can choose per task.
You also need a KernDX org for any of this to apply. These tools observe and exercise KernDX integrations, events, and async chains; on an org that doesn't run the framework, there is nothing for them to show.
The tour below follows the same order, from the home page through each job. The walkthroughs are recorded in a live KernDX org. Jump straight to a section:
Start here: the Kern Home control room
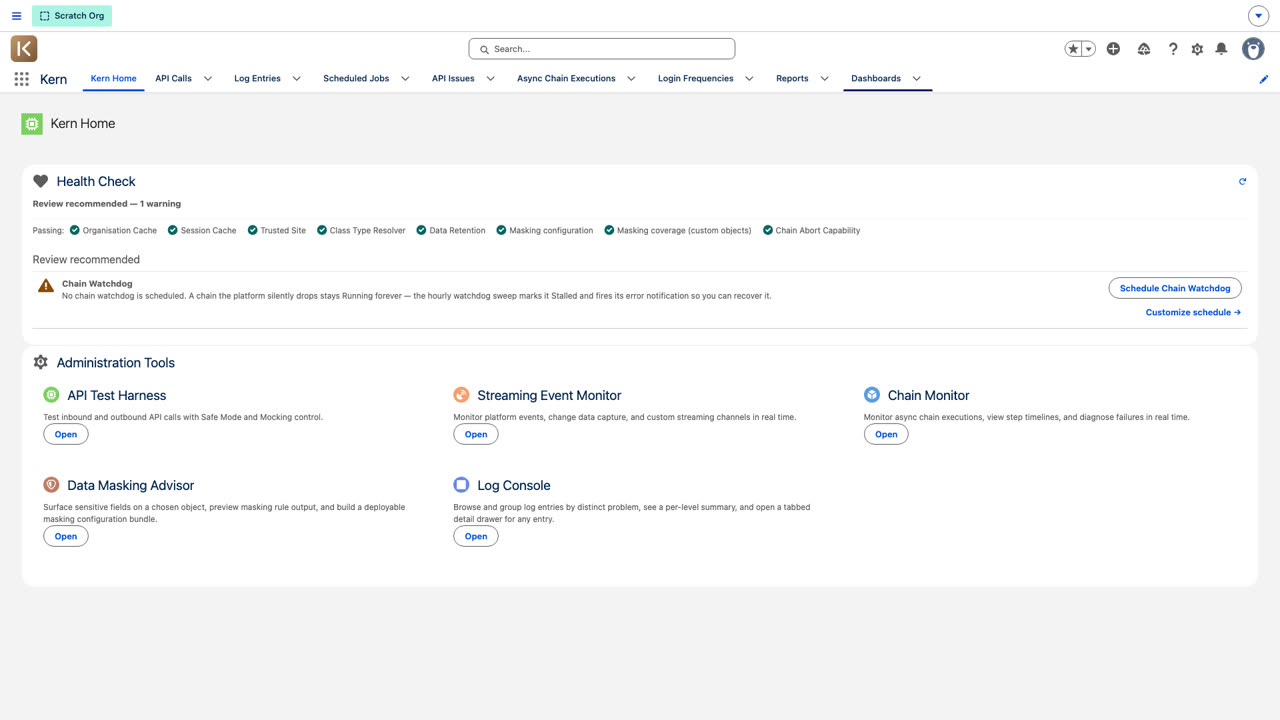
Open the Kern app and you land on Kern Home. It is the front door to everything else, laid out in two parts:
- A readiness banner across the top that checks whether the org is configured correctly (covered next).
- Launch cards under an Administration Tools heading (the same name as this guide), one for each interactive tool: the API Test Harness, the Streaming Event Monitor, the Chain Monitor, the Data Masking Advisor, and the Log Console.
The app's navigation bar gives you the records behind the tools: API Calls, Logs, Scheduled Jobs, API Issues, Async Chain Executions, and a login summary, alongside Reports and Dashboards.
One thing worth knowing: the five tools are launched from the home cards, not pinned as their own tabs. Kern Home is the intended way in. (They are also listed in the App Launcher if you prefer to search for one by name.)
Is your org set up correctly? (Health Check)
Before you rely on the framework, you want to know it is wired up properly. The readiness banner on Kern Home runs a short series of checks the moment the page loads and sorts the results into three groups: Action required for anything failing, Review recommended for things worth a look, and Passing for everything already in good shape. When all of it passes, the banner collapses to a single "all systems operational" line.
The checks cover the configuration KernDX depends on: the platform cache it uses for state and retries, the trusted site for callouts back to your own org, the class that points the framework at your Apex, a data-retention schedule that stops the framework's own logs and call records growing without limit, your data-masking coverage, whether the chain-abort capability is enabled and granted, and whether the stalled-chain recovery job (the Chain Watchdog) is scheduled.
Many of the warnings can be fixed right there. Where a check is flagged because nothing is purging old framework records, for example, one action schedules the recommended clean-up jobs for you and the row flips to Passing without leaving the page. The Chain Watchdog row works the same way: one click schedules the recovery job with the recommended defaults.
This is a check of your KernDX configuration, and it is separate from Salesforce's own Health Check in Setup, which scores your org's security settings against a baseline. The two answer different questions: this one tells you the framework is ready to run; the Setup one tells you your org's security posture. For how to set the checks up after install, see Health Check in the Utilities Guide and the post-install steps in the Installation Guide.
Monitor the system
Monitoring here means keeping an eye on your KernDX integrations, events, and async work, not your whole org. The live tools show activity as it happens; the record tabs keep the history.
Streaming Event Monitor
Subscribe to platform events, Change Data Capture, and custom channels, then watch messages land on a live timeline. Publish test events from the same screen.
See event-driven work that's normally invisible without standing up your own streaming infrastructure (a CometD client) or a separate subscriber app. Publish an event and watch it arrive the moment it's sent, with its full payload.
This tool is adapted from Philippe Ozil's Streaming Monitor, which he released to the public domain under CC0-1.0, rebuilt to follow KernDX conventions. If you want the monitor on its own, without the framework, install his instead: it is free on the AppExchange and it is the better choice for that.
Two readings sit alongside the event timeline in the same tool:
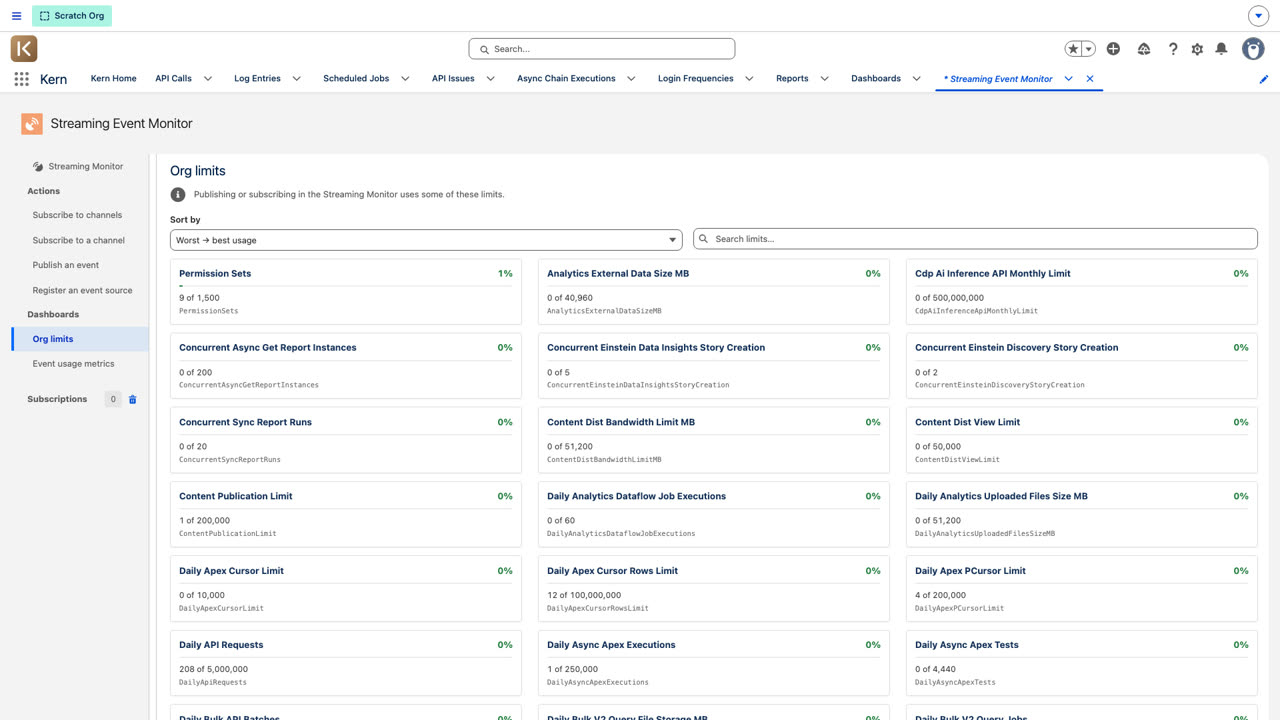
- Org limits. A live view of how much of your event and async capacity you have used, so you can spot a runaway publish loop before it hits a ceiling. Salesforce exposes the same numbers through Setup's System Overview and the limits API; this view simply puts the integration-related ones in front of you while you work.
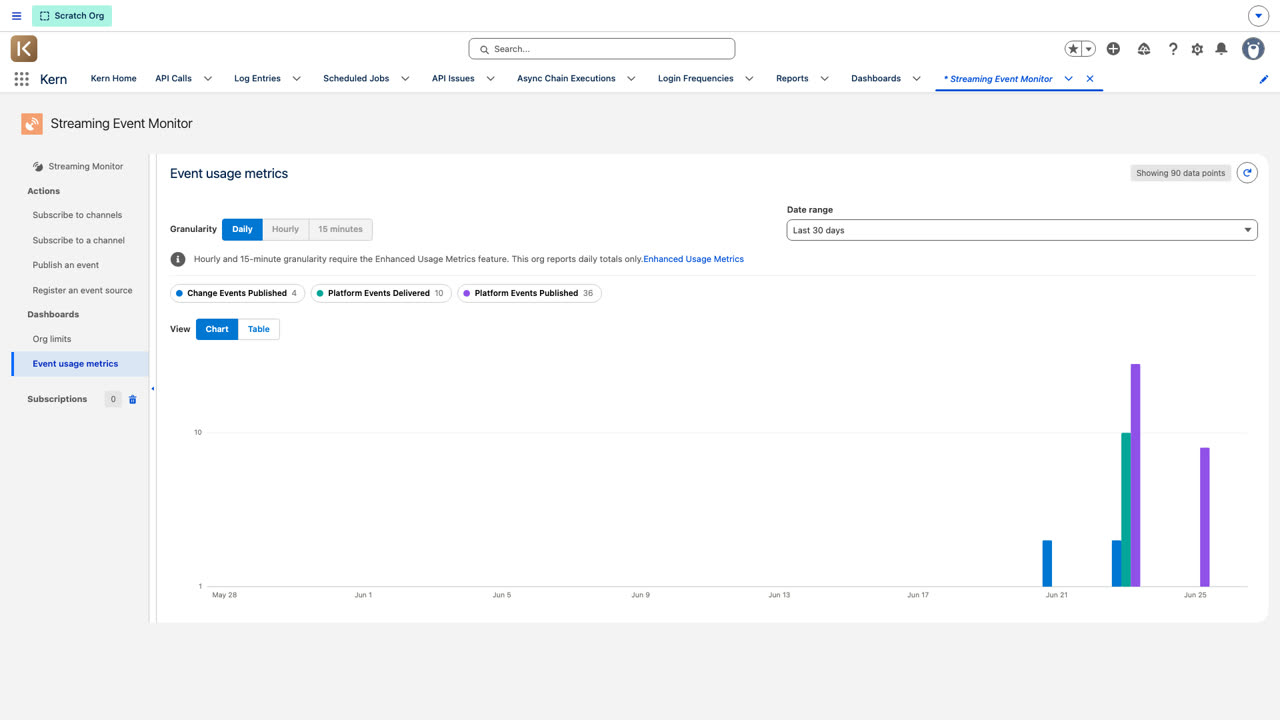
- Event usage metrics. Daily delivery counts for your platform events, which you can also pull from Salesforce's own
PlatformEventUsageMetric. The monitor charts them so a drop or a spike is obvious at a glance.
Where the records live: logs, calls, and runs
The live tools are for watching; the tabs in the navigation bar are where the history is kept. Four are worth knowing:
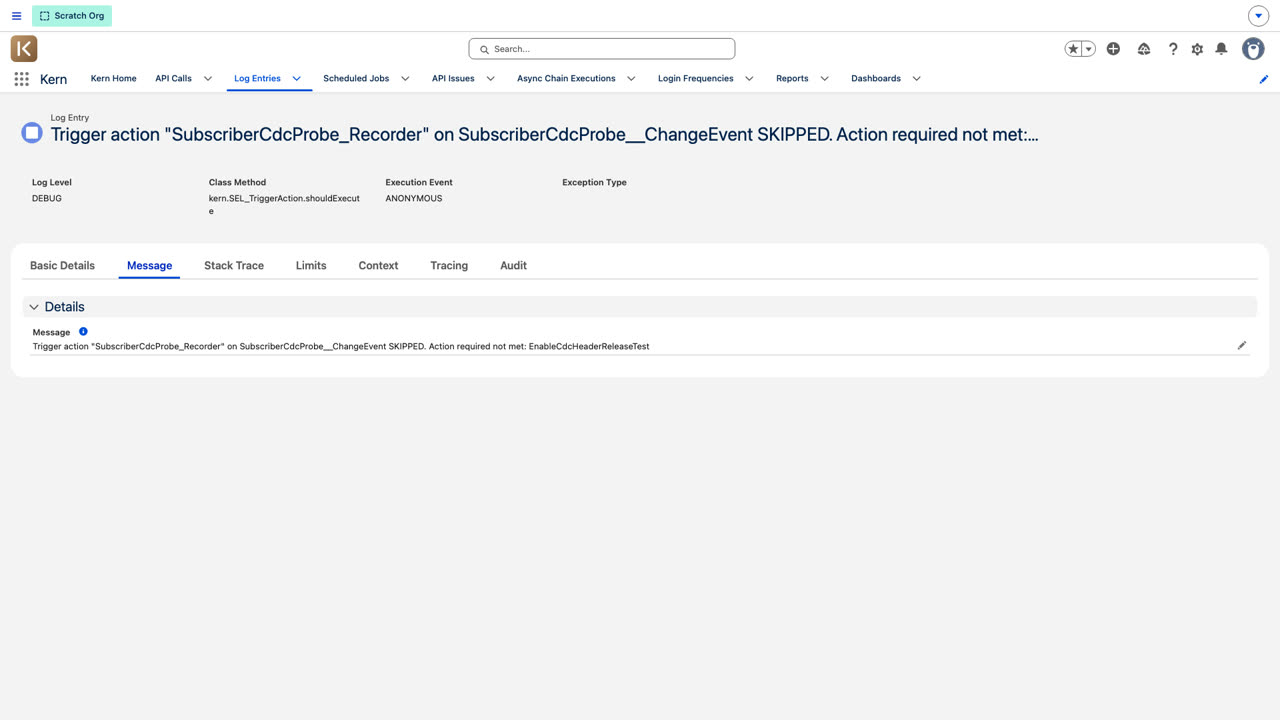
- Logs record what your code did, one row per logged event, each carrying a correlation ID (one tracking ID that follows a single user action across triggers, queries, callouts, and jobs), a duration, and an occurrence count for repeated events. The tab keeps the raw rows; when you want to browse or diagnose them, open the Log Console instead, which groups repeats into problems and lays a whole correlated run out on one timeline. See the Logging Guide for how to write to the log from your own Apex.
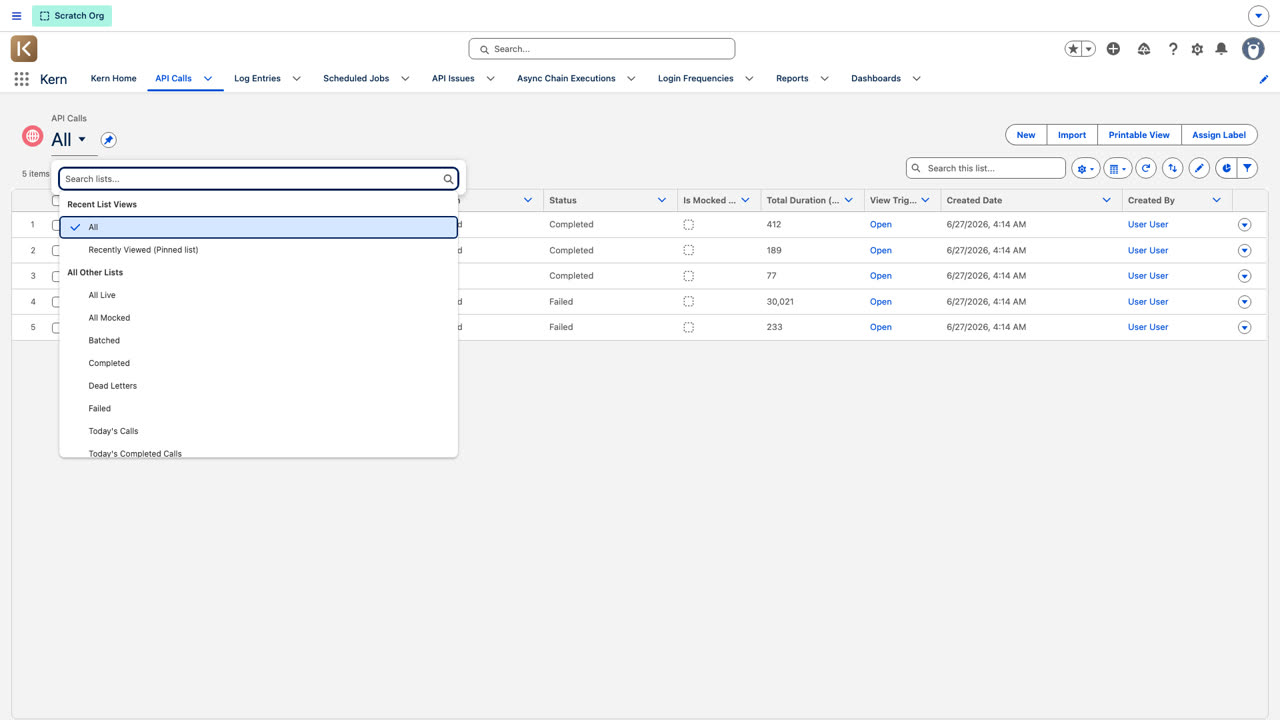
- API Calls keep every inbound and outbound call with its request, response, status, and timing. Ready-made list views narrow the noise: Today's Calls, Today's Failed Calls, Dead Letters, and more.
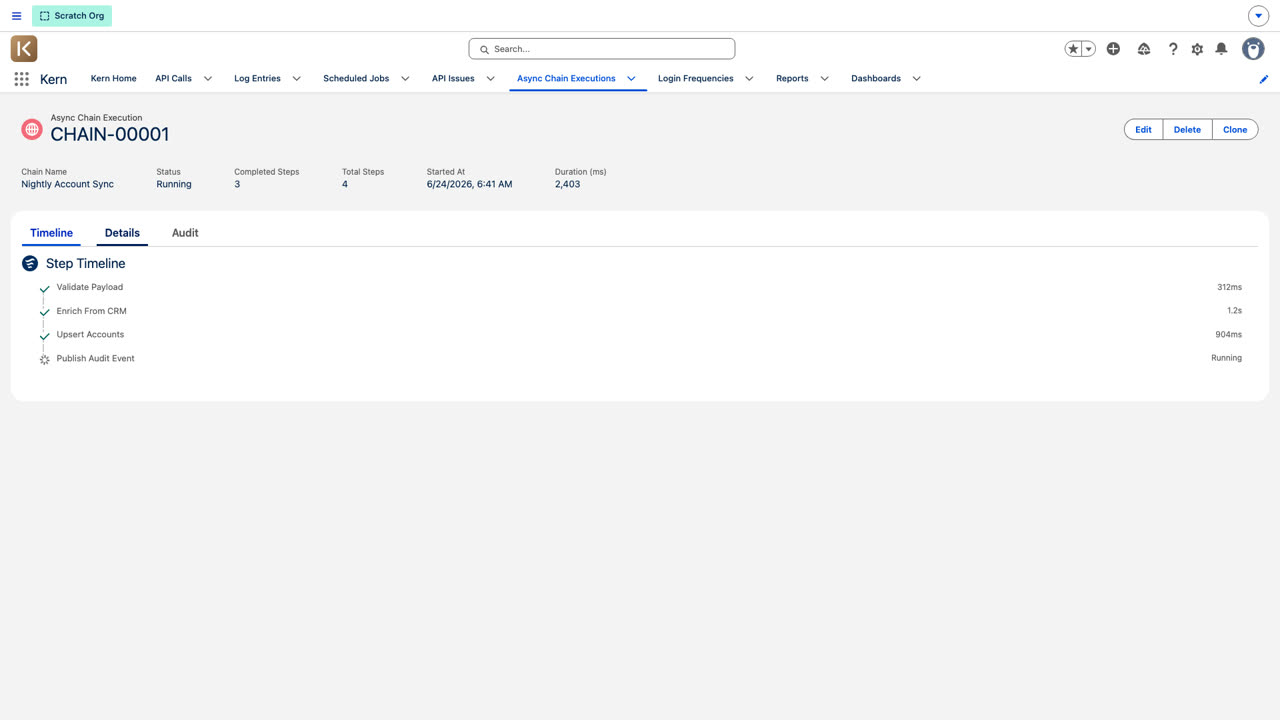
- Async Chain Executions record each multi-step async run: its status, how many steps finished, and how long it took. This is the history behind the Chain Monitor.
- Login summary rolls up logins per user per month, a convenience for developers and ops. For the authoritative record of who signed in and when, use Salesforce's own Login History.
Troubleshoot problems
When something breaks, these tools take you from "a call failed somewhere" to the exact request, the exact step, and a way to put it right.
API Test Harness
Fire inbound and outbound API calls from a form, with mocking and Safe Mode rollback built in.
Exercise a real Apex integration without Postman, throwaway anonymous Apex, or leftover test data. Safe Mode rolls back every database write. Mocking returns canned responses, so you can test a callout with no live endpoint.
Chain Monitor
Follow an async chain step by step: each step's status, timing, and any error on one timeline.
When a multi-step async job fails, the platform barely tells you which step broke or how far it got. The Chain Monitor lays out every step and shows exactly where it stopped. And when a run is still going but needs to be stopped, the same screen offers an abort action to the users you have granted it to: it asks for confirmation first, then marks the run Aborted.
The same screen can recover as well as stop. Users you grant the re-drive permission can retry a failed chain from its failed step (when the step declared itself safe to re-run), restart a chain whose author allowed restarts from the start as a new run, and clear stalled chains on demand; a separate grant controls the kill switch (a master off-switch you can flip in an incident without a deployment), which suspends and resumes all chain processing. A live activity stream in the detail panel shows each run's log entries as they happen. Every action ships switched off until you assign its permission set; see the Async Processing Guide for how each is enabled and why an action can be unavailable.
Log Console
Browse everything your code logged, grouped into recurring problems rather than a wall of rows, and drill from a problem to the exact run that caused it.
Log records are flood-controlled: repeats of the same event roll up into one row with an occurrence count, which keeps the table small but makes raw list views awkward to diagnose from. The Log Console does that reading for you. Its Problem summary view folds the window down to distinct problems ("this error, N occurrences"); the Individual entries view shows the flat rows when you need every event. A summary ribbon across the top counts entries per level and names the top sources in the window, so you can see at a glance where the noise is coming from.
The console also works the grouping out for itself, so recurring errors group into problems even where nobody tagged them in code. In Setup > Custom Settings > Log Setting you can change how many repeats it takes before something is listed as a problem, which log levels are covered, or turn the automatic grouping off altogether. None of those change what gets logged, and none of them deletes anything.
From either view you can narrow the window with a date-range picker (rolling windows from the last 15 minutes up to the last 30 days, calendar presets, or a custom range), search the text, sort any column, and keep scrolling as more rows load. Selecting a row opens a detail drawer that lays the whole correlated run out as a timeline: every entry sharing the same tracking ID, in order, with the originating user, and usage bars for the resource limits the entry recorded. The Chain Monitor's View logs button jumps straight from a failed async step to its correlated logs here.
The console reads every user's log rows, so access sits behind the Kern Administrator permission set. For the full walkthrough, see The Log Console in the Logging Guide.
Triage and retry failed integration calls
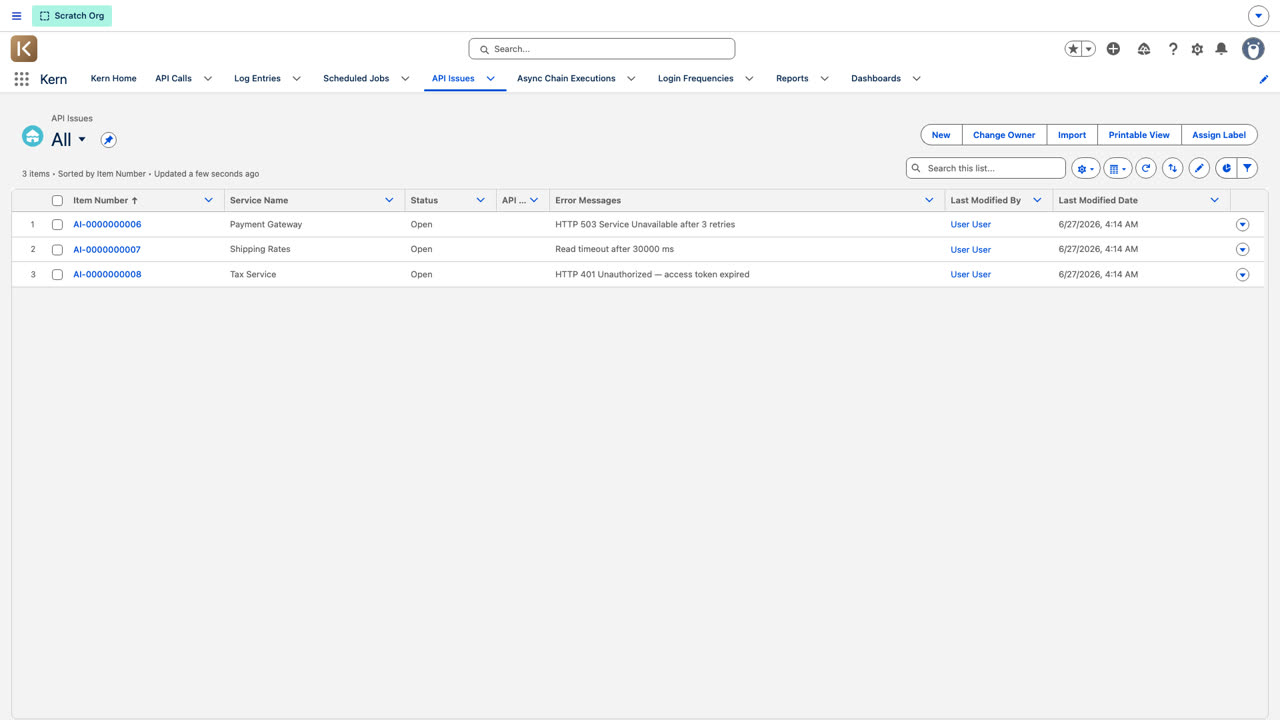
When an outbound call fails for good (after its automatic retries), KernDX records it as an API issue so it doesn't just vanish into the logs. The API Issues tab is the queue of these: each row links back to the call that failed, the error, and the request that caused it. The Requests Failed Today list view narrows it to the ones still open from today.
Open a failed issue and you get a Retry action that re-runs the original call there and then, with no anonymous Apex and no rebuilt request. If it succeeds, the issue is marked resolved; if it fails again, you keep the record to dig further.
Develop and onboard
The last group is for setting an org up and growing it: putting recurring work on a schedule, building a masking configuration, wiring the framework to your own classes, and rolling features out gradually.
Schedule a recurring job without code
To run a class on a schedule, you normally write a System.schedule call with a cron string and hope you got it right. KernDX turns that into a form. You pick the class from a list, choose when it should run, and save a schedule record; the framework starts, stops, and watches the job for you.
The "when" is the useful part. You can start from a Preset (every hour, every weekday morning), drop to Advanced for finer control, or write a Custom cron expression directly. Whichever you use, a plain-English description rewrites itself as you go ("Every weekday at 6:00 AM"), and an impossible schedule is caught before you can save it (it will tell you, for instance, that day 31 does not exist in February).
Salesforce's own Schedule Apex screen can do the basics if you are comfortable writing cron by hand and already have a schedulable class. This builder is for getting a correct schedule in place quickly, and for changing it later without touching code. For the declarative scheduling record behind it, see Declarative Scheduling with ScheduledJob__c in the Async Processing Guide.
Data Masking Advisor
Scan your objects for sensitive fields, see what's already masked, and build a deployable masking configuration.
Skip the manual audit and hand-written rules: the advisor finds likely-sensitive fields for you and assembles a masking package you can deploy, so those fields are redacted as records are written.
Generate a Class Type Resolver
Because KernDX ships as a managed package, it cannot see your Apex classes by name on its own. You tell it where to look with a small "type resolver" class, the bit of glue that lets the framework find the classes in your namespace. You write this once per org.
The Kern Home setup helper writes the class for you. On the readiness banner, the Class Type Resolver check shows a Setup button that opens the helper: name the class, and it generates a ready-to-paste resolver (and a matching test class) to copy or download.
This is the resolver it generates:
@SuppressWarnings('PMD.AvoidGlobalModifier')
global with sharing class ACME_ClassTypeResolver extends kern.UTIL_TypeResolver.BaseClassResolver
{
	public override Type resolveType(String className)
	{
		return getTypeForClassName(className) ?? (Type)nextResolver?.resolveType(className);
	}

	private static Type getTypeForClassName(String className)
	{
		Type classType;

		if(String.isNotBlank(className))
		{
			String namespace = kern.UTIL_System.getNamespacePrefix(kern.UTIL_System.getClassNamespace(className), '.');

			classType = Type.forName(namespace, className);
			classType = classType == null && String.isNotBlank(namespace) ? Type.forName('', className) : classType;
		}

		return classType;
	}
}
Rename ACME_ClassTypeResolver to suit your org. Two steps then happen outside the helper, on purpose. You deploy the class like any other Apex (Salesforce blocks creating Apex through a setup screen in production), then register its name on the Class Type Resolver custom metadata record so the framework knows to call it. For the full walkthrough, see Type Resolution in the Code Conventions Guide.
Feature flags. KernDX has no dedicated screen for these; you manage them as records and read them in code. See the Feature Flags Guide for how to define and check a flag.